RESULTS
Our results showed the 2°C site as being the most effective for both inhibition and regrowth with the PF1 treatment showing a 98.87% average for inhibition (Figure 7) and the PF2 showing the lowest average regrowth at 3.46% (Table 2 and Figure 8). PF2 was the most effective inhibitor of P. destructans at the 5°C temperature with a mean inhibition of 78.66% and B23 was the most effective inhibitor at 10°C with a mean of 77.47%. PF2 also had the lowest regrowth percentage among other sites with a mean of 5.82% and 10.02% at the 5°C and 10°C sites, respectively.
|
Table 2. Means of percent inhibition and regrowth for the different treatments at all three sites.
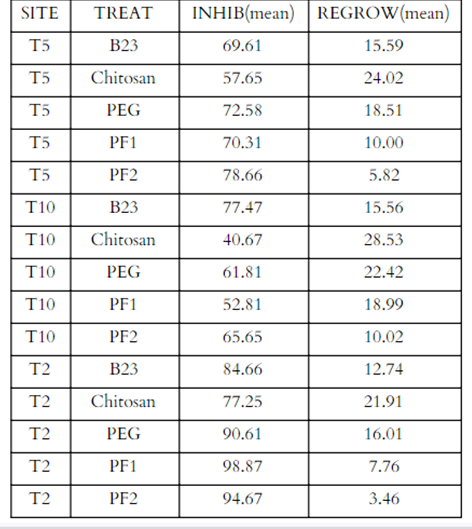
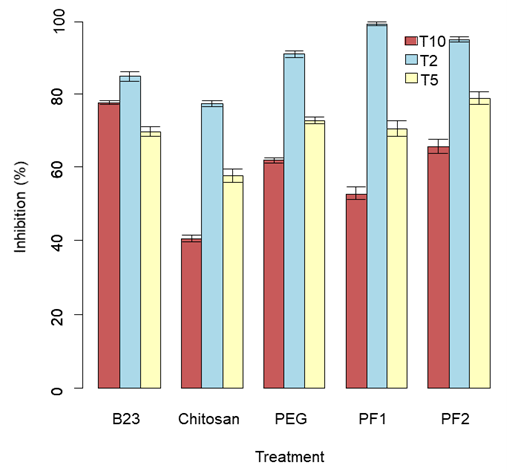
Figure 7. Bar plot of treatment type inhibition (%) at sites T10, T2, and T5.
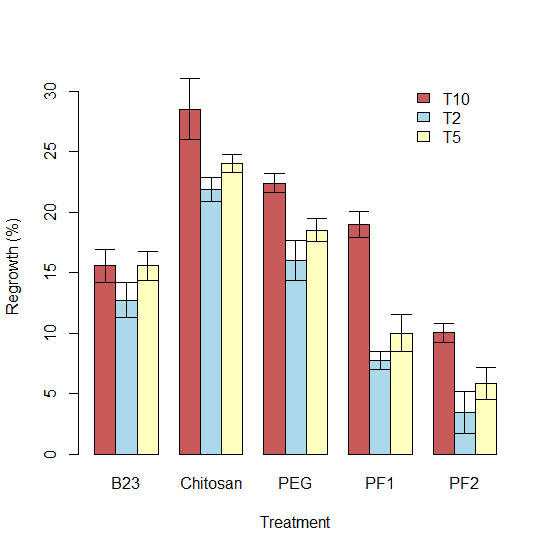
Figure 8. Bar chart of treatment types and regrowth (%) at sites T10, T2, and T5.
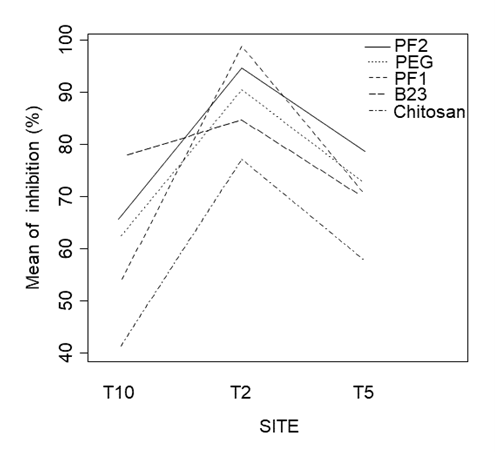
Figure 9. Interaction plot for inhibition between treatments at different sites.
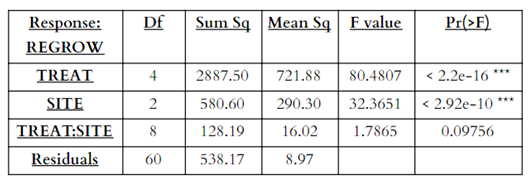
For the multi factor ANOVA for percent inhibition (Table 3), main effects from treatment and site were significant (p<0.05), as well as interaction effects between treatments and sites (p<0.05) (Figure 9). The multi factor ANOVA for regrowth percentage (Table 4), showed similar significant results for the main effects of treatment and site, but the interaction effects for treatment and site were not significant (p>0.05).
Table 3. ANOVA table for percent inhibition (INHIB) as the response variable and treatment (TREAT) and temperature (SITE) as the independent variables (*** indicates significant result).
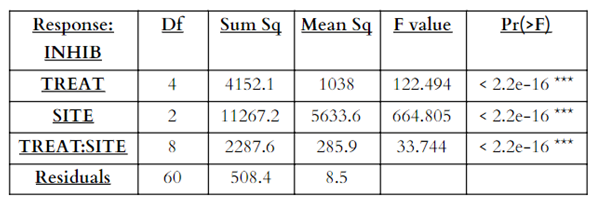
Table 4. ANOVA table for percent regrowth (REGROW) as the response variable and treatment (TREAT) and temperature (SITE) as the independent variables (*** indicates significant result).
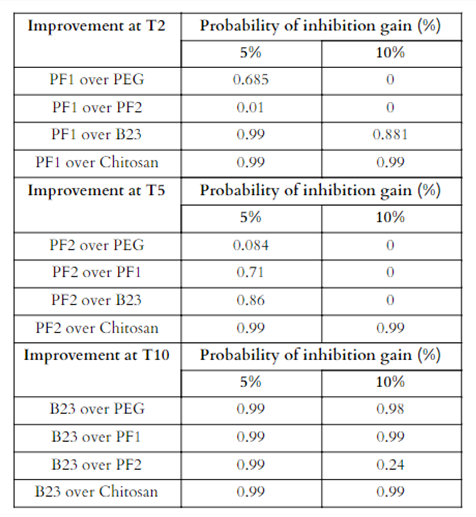
The significant interaction effects from the inhibition ANOVA were then tested using effect size statistics for their probabilities of percent gain (5 and 10% gain) (Table 5). At T2, PF1 was the highest inhibitor with a gain of at least 5% over B23 and Chitosan treatments with a probability of 99%. PF1 was very similar to PF2 with only showing a 1% chance that it would be 5% greater at T2 and only a 68.5% chance of being 5% greater than the PEG treatment. Probabilities of having a 10% better inhibition rate were near 0 for both PEG and PF2, but still fairly high at 88% and 99% over B23 and Chitosan, respectively. At T5, PF2 was the greatest inhibitor with probabilities of over 70% of having an inhibition 5% or greater over PF1, B23, and chitosan, but only a 8% chance over PEG. Probabilities for 10% greater inhibition were much lower with all near 0% chance except for chitosan, which PF2 still had a 99% chance of having a 10% better inhibition rate. Lastly, at T10, B23 was the greatest inhibitor with a 99% probability of being 5% or greater over all other treatments and the same at 10%, except for when compared to PF2, where B23 only had a 24% probability of having a 10% or greater inhibition rate.
Table 5. Probabilities of percent gain (5% and 10%) inhibition at each temperature using the most effective treatment compared to the others.
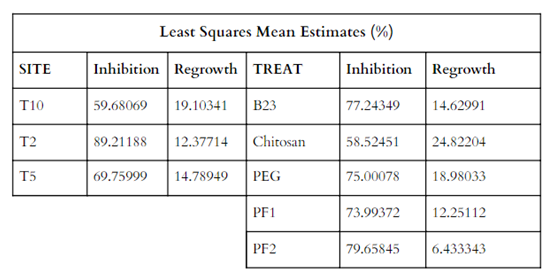
Since the ANOVA showed significant results for both treatment types and temperature levels, we ran effect size statistics to determine the size of the treatment effects. We used the Estimated Marginal Means of both independent variables (Table 6).
Table 6. Estimated marginal means (least squares means) for the temperature levels and treatment types.
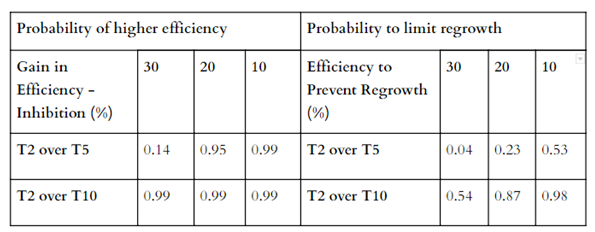
The most efficient temperature level ( T2- 2°C) significantly inhibited the growth of P. destructans by at least 30 % more than the inhibition found at 10 °C with an alpha level of 0.05 (all results displayed in Table 7). Compared to the 5°C treatment, T2 was significant up to 20% more inhibition. When estimating the size of regrowth, T2 was only significant compared to T10 with a maximum of 10% lower regrowth rate.
Table 7. Probabilities that the most efficient temperature (T2) will show 30, 20,or 10 percent more inhibition and less regrowth than the other two temperatures.
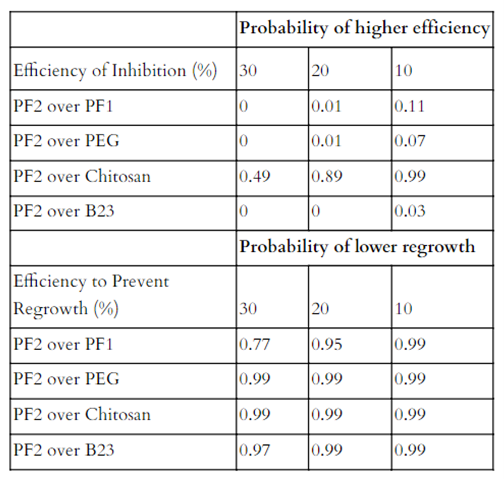
The treatments against P. destructans were also evaluated with the same percent threshold (Table 8). The most efficient treatment PF2, has the highest inhibition rates against Chitosan, but was only significant at a 10% . PF2 only showed very low probabilities of being at least 10% more efficient against inhibition than the other treatments. PF2 significantly showed at least 30% less regrowth compared to all other treatments, except against PF1, where it was significant up to 20% less regrowth.
Table 8. The probabilities that inhibition will be 30, 20, or at least 10 percent higher and regrowth lower in PF2 compared to the other treatments
Least square means for the three temperatures for both inhibition (Figure 10) and regrowth (Figure 11) were determined to compare for statistical differences within the different temperatures at alpha= 0.05. The Sidak adjustment was suggested by R due to the multiple comparisons. The statistical differences are represented in the figures by different lower case letters. Inhibition was significantly different at temperature T2 compared to T10 and T5, but T5 and T10 were not significant. Regrowth only showed significant differences between T2 and T10.
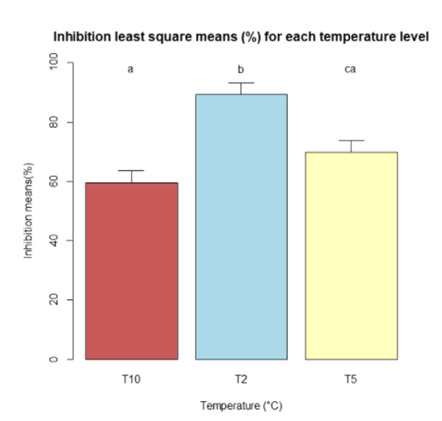
Figure 10. Bar chart of the least square means of inhibition for the three temperatures (T2, T5, T10). The bars with the different lower case letters “a, b, and c” represent a significant difference among treatments, while bars with the same letter represent no significant difference at alpha= 0.05.
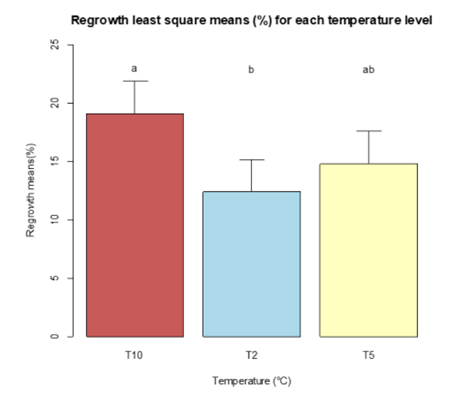
Figure 11. Bar chart of the least square means of regrowth for the three temperatures (T2, T5, T10). The bars with different lower case letters “a and b” represent the significant difference among treatments, while bars with the same letter represent no significant difference at alpha= 0.05.
Least square means were also used to compare for significant differences within the five different treatments for both inhibition (Figure 12) and regrowth (Figure 13) at alpha=0.05 and using the Sidak adjustment due to multiple comparisons (the Bonferroni adjustment yielded the same significance in all results). For inhibition, the only treatment significantly different than the others was chitosan, which had the lowest inhibition percentage of all the treatments. Regrowth showed greater variability with all treatments being significantly different except for B23, which was not significantly different when compared to PEG or PF1.
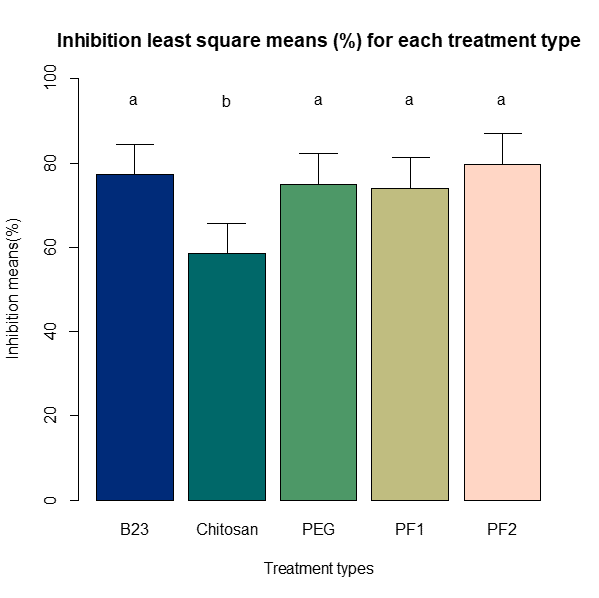
Figure 12. Bar chart of the least square means of inhibition (%) for the five treatments. The bars with different lower case letters “a and b” represent the significant difference among treatments, while bars with the same letter represent no significant difference at alpha= 0.05.
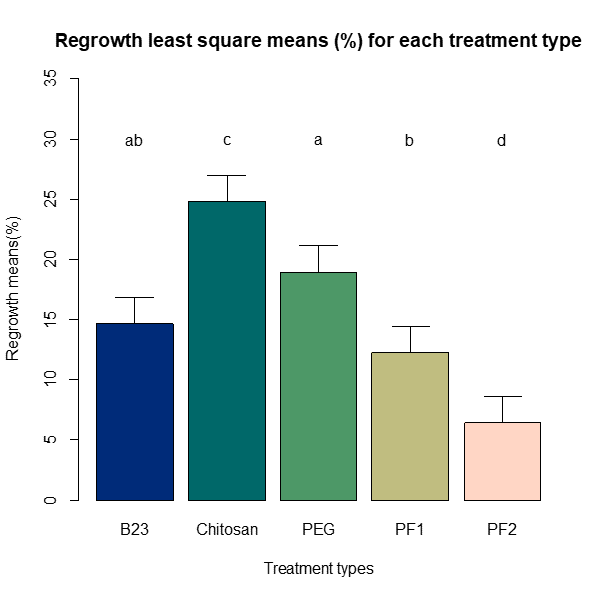
Figure 13. Bar chart of the least square means of regrowth (%) for the five treatments. The bars with different lower case letters “a and b” represent the significant difference among treatments, while bars with the same letter represent no significant difference at alpha= 0.05.
|
DISCUSSION
The E. fuscus strain of Pseudomonas spp (PF1) had a high inhibition rate in all three temperature setting, followed by PF2, where it delayed the growth of P. destructans or even arrested it, as seen in other studies (Hoyt et al., 2015). The lower the temperature, the greater inhibition seemed to occur, which suggests that our treatments would be the most effective in hibernacula where the temperature is near 2°C. Since chitosan had been tested with success for antibacterial properties against other fungal pathogens, we were expecting some degree of inhibition against P. destructans (Sudarshan, Hoover, Knorr, 2009). Additionally, it had been tested in the field trial against WNS by Hoyt et al. (2019), but no significant results were found in the overwinter survival of bats. We believed testing chitosan could’ve determined if this treatment can fight P. destructans at different temperatures representative of hibernacula found in Canada. Despite showing low inhibitory effects in our results, the antibacterial properties of chitosan against fungus were worth exploring, since the available information of in-vitro testing is lacking. However, since our study showed that this treatment was the least performing overall, it suggests that chitosan might not be the most appropriate option to continue testing in field studies.
Both chemical treatments, B23 and PEG 8000, have been used in the past to fight fungal infections. B23 is a chemical mix of 23 compounds and is already used to fight fungus in horse bedding; PEG 8000 has been used in agriculture (Hiolski, 2018). Both chemicals have been tested in roosts and other bat habitats in the United States, but there are no conclusive results at this stage (White Nose Syndrome Response Team C, n.d.). Due to their previous use against fungal pathogens, we expected both chemical compounds to be effective against P. destructans in our study. Our study also showed the chemical treatments to be effective; the results indicated between 84-90% inhibition at 2°C, and B23 was the most efficient of all treatments at 10 °C, with 99% probabilities to have a 5% higher inhibition rate. Since the other treatments showed a lower performance at 10 °C, B23 should be considered as a treatment option in hibernacula with higher temperature. It is important to note that while the chemical treatments appeared to be effective in a lab setting, the results in the field might differ, since the chemicals will be applied to the environment as opposed to the bat itself.
Both chemical treatments, B23 and PEG 8000, have been used in the past to fight fungal infections. B23 is a chemical mix of 23 compounds and is already used to fight fungus in horse bedding; PEG 8000 has been used in agriculture (Hiolski, 2018). Both chemicals have been tested in roosts and other bat habitats in the United States, but there are no conclusive results at this stage (White Nose Syndrome Response Team C, n.d.). Due to their previous use against fungal pathogens, we expected both chemical compounds to be effective against P. destructans in our study. Our study also showed the chemical treatments to be effective; the results indicated between 84-90% inhibition at 2°C, and B23 was the most efficient of all treatments at 10 °C, with 99% probabilities to have a 5% higher inhibition rate. Since the other treatments showed a lower performance at 10 °C, B23 should be considered as a treatment option in hibernacula with higher temperature. It is important to note that while the chemical treatments appeared to be effective in a lab setting, the results in the field might differ, since the chemicals will be applied to the environment as opposed to the bat itself.
ConclusionBats are an important species both economically and ecologically and thus, developing mitigation strategies to increase their survivability against WNS is crucial. Our study aimed at answering two research questions: 1) to determine the inhibition and regrowth percentage of the different biological and chemical treatments on P. destructans and 2) to determine the most effective temperature for treatment to reduce the growth of P. destructans. We tested the efficacy of five different treatment types against P. destructans and determined that the biological controls PF1 and PF2 were the most effective at 2°C and 5°C respectively, but were not always significant. At 10°C, B23 was the most effective and significant, with a 5% greater inhibition rate at 2 °C. Since our results demonstrated that the effectiveness of treatments differed when analyzed separately from the influence of temperature, the temperature of a hibernacula should be considered when selecting the right treatment against P. destructans. Despite these results, field testing still presents many obstacles due to the remoteness of hibernacula and the challenge of applying treatments to as many individuals as possible. While further research is required to determine the efficacy of these treatments in the field, our results show that PF1, PF2, and B23 are promising options.
REFERENCES |
Bat Conservation Trust. (n.d.). Why bats matter. Retrieved from: https://www.bats.org.uk/about-bats/why-bats-matter
Blehert, D. S., Hicks, A. C., Behr, M., Meteyer, C. U., Berlowski-Zier, B. M., Buckles, E. L., et al. (2009). Bat White-nose Syndrome: An emerging fungal pathogen? Science (New York, N.Y.), 323(5911), 227.
Boyles, J.G., Cryan, P. M., McCracken, G. F., & Kunz, T. H. (2011). Economic importance of bats in agriculture. Science, 332(3025), 41-42. doi: 10.1126/science.1201366
COSEWIC. (2013). COSEWIC Assessment and Status Report on the Little Brown Myotis (Myotis lucifugus), Northern Myotis (Myotis septentrionalis), and Tri-colored Bat (Perimyotis subflavus) in Canada. Retrieved from: https://www.canada.ca/en/environment-climate-change/services/species-risk-public-registry/cosewic-assessments-status-reports/little-brown-myotis-tri-coloured-bat-2013.html
Grieneisen, L. (2011). Hibernacula microclimate and white-nose syndrome susceptibility in the little brown myotis (Myotis lucifugus). Master’s Theses. 12. Retrieved from https://digitalcommons.bucknell.edu/masters_theses/12
Hiolski, E. (2018). Battling a deadly bat fungus. ACS Cent Sci, 4(3). doi: 10.1021/acscentsci.8b00153
Hothorn, T., Bretz, F., and Westfall, P. (2008). Simultaneous Inference in General Parametric Models. Biometrical Journal 50(3), 346--363.
Hoyt, J. R., Cheng, T. L., Langwig, K. E., Hee, M. M., Frick, W. F., & Kilpatrick, A. M. (2015). Bacteria isolated from bats inhibit the growth of Pseudogymnoascus destructans, the causative agent of white-nose syndrome. PLOS ONE. doi: 10.1371/journal.pone.0121329
Hoyt, J. R., Langwig, K. E., White, J. P., Kaarakka, H. M., Redell, J. A., Parise, K. L., Frick, W. F., Foster, J. T., & Kilpatrick, A. M. (2019). Field trial of a probiotic bacteria and a chemical, chitosan, to protect bats from white-nose syndrome. bioRxiv. doi: 10.1101/567826
Mcdonald, A., Lutsch, K., Gabriel, K., & Cornelison, C. (2019). Evaluating volatile organic compounds for contact-independent antagonism of Pseudogymnoascus destructans. Kennesaw State University. [Poster]. Retrieved from https://digitalcommons.kennesaw.edu/undergradsymposiumksu/2018/Posters/9/
Morales, M., with code developed by the R Development Core Team, with general advice from the R-help listserv community and especially Murdoch, D. (2020). sciplot: Scientific Graphing Functions for Factorial Designs. R package version 1.2-0. https://CRAN.R-project.org/package=sciplot
R Core Team (2019). R: A language and environment for statistical computing. R Foundation for Statistical Computing, Vienna, Austria. URL https://www.R-project.org/.
Reichard, J. D., & Kunz, T. H. (2009). White nose syndrome inflicts lasting injuries to the wings of little brown myotis (Myotis lucifugus). Acta Chiropterologica, 11(2), 457-464. doi: 10.3161/150811009X485684
Russell V. L. (2020). emmeans: Estimated Marginal Means, aka Least-Squares Means.
R package version 1.5.3. https://CRAN.R-project.org/package=emmeans
Spencer Graves, Hans-Peter Piepho and Luciano Selzer with help from Sundar Dorai-Raj (2019). multcompView: Visualizations of Paired Comparisons. R package version 0.1-8. https://CRAN.R-project.org/package=multcompView
Sudarshan, N. R., Hoover, D. G., Knorr, D. (2009). Antibacterial action of Chitosan. Food Biotechnology, 6(3), 257-272. doi: 10.1080/08905439209549838
Thermo Fisher Scientific. (2020). Thermo Scientific sabouraud dextrose agar: Description. Retrieved from https://www.fishersci.ca/shop/products/sabouraud-dextrose-agar/p-4 522926
White Nose Syndrome Response Team A. (n.d.). What is white nose syndrome? Retrieved from: https://www.whitenosesyndrome.org/static-page/what-is-white-nose-syndrome
White Nose Syndrome Response Team B. (n.d.). Helping bats survive. Retrieved from: https://www.whitenosesyndrome.org/static-page/helping-bats-survive
Wickham, H. (2011). The Split-Apply-Combine Strategy for Data Analysis. Journal of Statistical Software, 40(1), 1-29. URL http://www.jstatsoft.org/v40/i01/.
