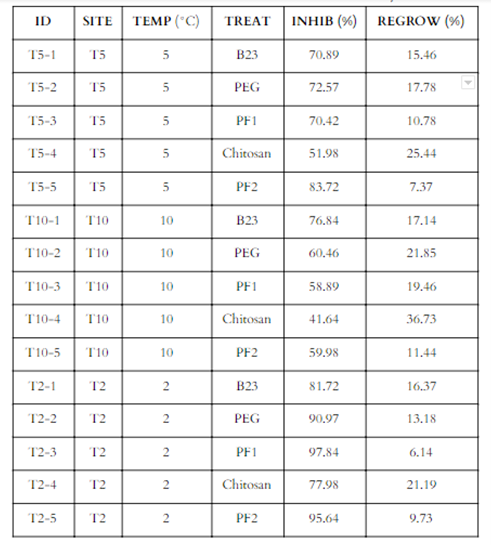
For our project, we created a dataset with three different sites representing three temperatures (T5 (5°C), T10 (10°C), and T2 (2°C)) (Table 1). We included two categorical predictor variables which were temperature and treatment. Each site (T5, T10, and T2) had five replications of each treatment (TREAT). Response variables were continuous and included inhibition (INHIB) and regrowth (REGROW) with experimental units expressed as a percentage of control growth (uninhibited). Random noise was added to the data set in R with three standard deviations of variability.
|
Table 1. Abbreviated table of the dataset used for the study.
We created two sets of boxplot graphs to visualize our preliminary results. In Figure 5, the boxplot shows that the inhibition against P. destructans was the highest at 2°C, and the lowest at 10°C when combining all treatments. The 10°C site also produced outliers towards the lower end of the inhibition capacity for the different treatments within the site. In terms of regrowth percentage, the 5°C and 2°C provided similar results, while the 10°C site had the highest rate of regrowth. Amongst all three, the 10°C site had the worst performance in both inhibition and regrowth percentage, with a median value of 60% in the inhibition rate and a regrowth of around 20%.
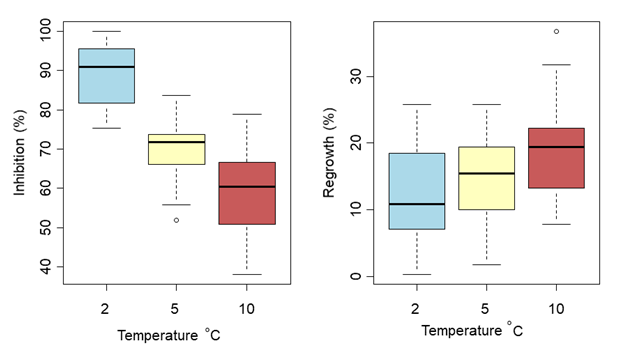
Figure 5. Boxplots representing the inhibition percent and regrowth percent with all treatments combined at each site.
In Figure 6, the results for the different treatments in each site are displayed separately. The range of observations tends to be narrower when our experimental units are represented by treatments compared to being grouped by sites. This visualization also shows the presence of outliers that were not visible when the results were grouped by sites only: in the 5°C site while testing for inhibition as well as in the 2°C and 10°C when testing for regrowth. Within each site, the treatments followed the same patterns with the PF1 being the most efficient to inhibit growth of P. destructans, followed by PF2, PEG 8000, B23, and finally chitosan. For the regrowth rate, each site also followed similar trends but the efficacy of treatments were different than for the inhibition rate. The treatment showing the lowest rate of regrowth was the PF2, followed by PF1, B23, PEG 8000, and lastly chitosan.
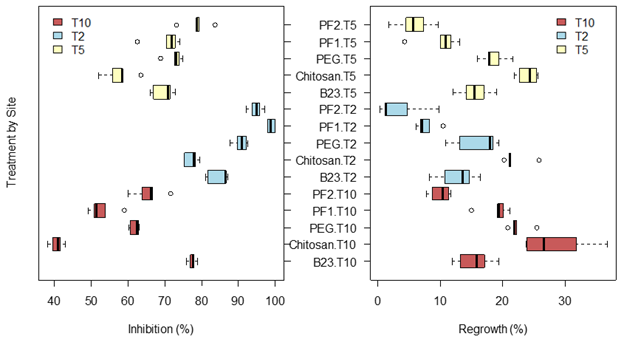
Figure 6. Boxplots for the inhibition and regrowth percentage of each treatment for the three different sites (temperature) represented in blue (2°C), red (10°C), and yellow (5°C)
|
